
MICCAI’22 Paper | CMPB’21 Paper | CIRDataset
This library serves as a one-stop solution for analyzing datasets using clinically-interpretable radiomics (CIR) in cancer imaging (https://github.com/choilab-jefferson/CIR). The primary motivation for this comes from our collaborators in radiology and radiation oncology inquiring about the importance of clinically-reported features in state-of-the-art deep learning malignancy/recurrence/treatment response prediction algorithms. Previous methods have performed such prediction tasks but without robust attribution to any clinically reported/actionable features (see extensive literature on the sensitivity of attribution methods to hyperparameters). This motivated us to curate datasets by annotating clinically-reported features at the voxel/vertex level on public datasets (using our published advanced mathematical algorithms) and relating these to prediction tasks (bypassing the “flaky” attribution schemes). With the release of these comprehensively-annotated datasets, we hope that previous malignancy prediction methods can also validate their explanations and provide clinically-actionable insights. We also provide strong end-to-end baselines for extracting these hard-to-compute clinically-reported features and using these in different prediction tasks.
CIRDataset: A large-scale Dataset for Clinically-Interpretable lung nodule Radiomics and malignancy prediction [MICCAI’22]
Wookjin Choi1, Navdeep Dahiya2, and Saad Nadeem3
1 Department of Radiation Oncology, Thomas Jefferson University Hospital
2 School of Electrical and Computer Engineering, Georgia Institute of Technology
3 Department of Medical Physics, Memorial Sloan Kettering Cancer Center
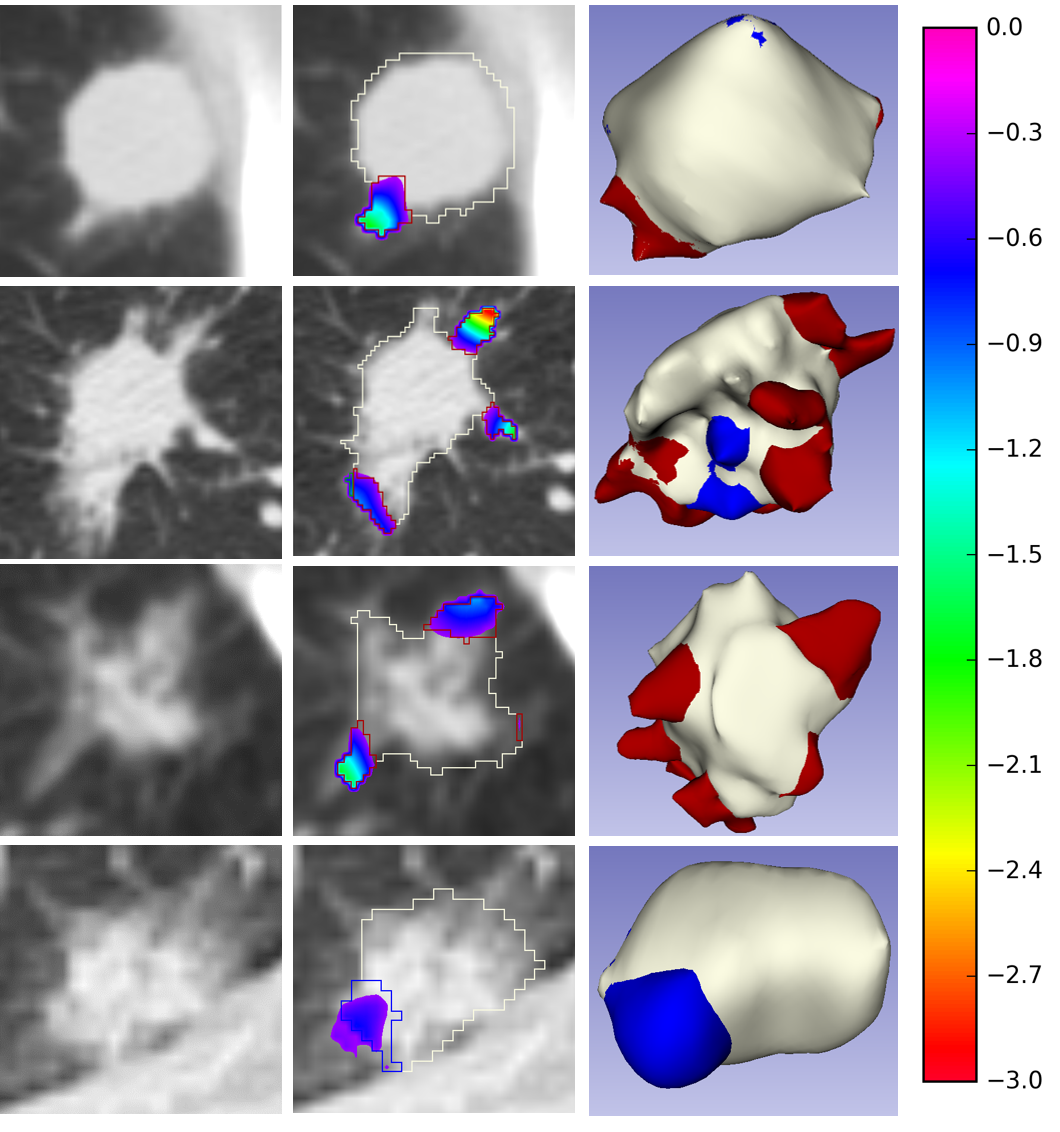
Spiculations/lobulations, and sharp/curved spikes on the surface of lung nodules, are good predictors of lung cancer malignancy and hence, are routinely assessed and reported by radiologists as part of the standardized Lung-RADS clinical scoring criteria. Given the 3D geometry of the nodule and 2D slice-by-slice assessment by radiologists, manual spiculation/lobulation annotation is a tedious task and thus no public datasets exist to date for probing the importance of these clinically-reported features in the SOTA malignancy prediction algorithms. As part of this paper, we release a large-scale Clinically-Interpretable Radiomics Dataset, CIRDataset, containing 956 radiologist QA/QC’ed spiculation/lobulation annotations on segmented lung nodules from two public datasets, LIDC-IDRI (N=883) and LUNGx (N=73). We also present an end-to-end deep learning model based on multi-class Voxel2Mesh extension to segment nodules (while preserving spikes), classify spikes (sharp/spiculation and curved/lobulation), and perform malignancy prediction. Previous methods have performed malignancy prediction for LIDC and LUNGx datasets but without robust attribution to any clinically reported/actionable features (due to known hyperparameter sensitivity issues with general attribution schemes). With the release of this comprehensively-annotated dataset and end-to-end deep learning baseline, we hope that malignancy prediction methods can validate their explanations, benchmark against our baseline, and provide clinically-actionable insights. Dataset, code and pre-trained models are available in this repository.
Dataset
The first CIR dataset, released here, contains almost 1000 radiologist QA/QC’ed spiculation/lobulation annotations (computed using our published LungCancerScreeningRadiomics library and QA/QC’ed by a radiologist) on segmented lung nodules for two public datasets, LIDC (with visual radiologist malignancy RM scores for the entire cohort and pathology-proven malignancy PM labels for a subset) and LUNGx (with pathology-proven size-matched benign/malignant nodules to remove the effect of size on malignancy prediction).
End-to-End Deep Learning Nodule Segmentation, Spikes’ Classification, and Malignancy Prediction Model
We also release our multi-class Voxel2Mesh extension to provide a strong benchmark for end-to-end deep learning lung nodule segmentation, spikes’ classification (lobulation/spiculation), and malignancy prediction; Voxel2Mesh is the only published method to our knowledge that preserves sharp spikes during segmentation and hence its use as our base model. With the release of this comprehensively-annotated dataset, we hope that previous malignancy prediction methods can also validate their explanations/attributions and provide clinically-actionable insights. Users can also generate spiculation/lobulation annotations from scratch for LIDC/LUNGx as well as new datasets using our LungCancerScreeningRadiomics library.

Results
The following tables show the expected results of running the pre-trained ‘Mesh Only’ and ‘Mesh+Encoder’ models.
Table1. Nodule (Class0), spiculation (Class1), and lobulation (Class2) peak classification metrics
| Training | ||||||
|---|---|---|---|---|---|---|
| Network | Chamfer Weighted Symmetric ↓ | Jaccard Index ↑ | ||||
| Class0 | Class1 | Class2 | Class0 | Class1 | Class2 | |
| Mesh Only | 0.009 | 0.010 | 0.013 | 0.507 | 0.493 | 0.430 |
| Mesh+Encoder | 0.008 | 0.009 | 0.011 | 0.488 | 0.456 | 0.410 |
| Validation | ||||||
| Network | Chamfer Weighted Symmetric ↓ | Jaccard Index ↑ | ||||
| Class0 | Class1 | Class2 | Class0 | Class1 | Class2 | |
| Mesh Only | 0.010 | 0.011 | 0.014 | 0.526 | 0.502 | 0.451 |
| Mesh+Encoder | 0.014 | 0.015 | 0.018 | 0.488 | 0.472 | 0.433 |
| Testing LIDC-PM N=72 | ||||||
| Network | Chamfer Weighted Symmetric ↓ | Jaccard Index ↑ | ||||
| Class0 | Class1 | Class2 | Class0 | Class1 | Class2 | |
| Mesh Only | 0.011 | 0.011 | 0.014 | 0.561 | 0.553 | 0.510 |
| Mesh+Encoder | 0.009 | 0.010 | 0.012 | 0.558 | 0.541 | 0.507 |
| Testing LUNGx N=73 | ||||||
| Network | Chamfer Weighted Symmetric ↓ | Jaccard Index ↑ | ||||
| Class0 | Class1 | Class2 | Class0 | Class1 | Class2 | |
| Mesh Only | 0.029 | 0.028 | 0.030 | 0.502 | 0.537 | 0.545 |
| Mesh+Encoder | 0.017 | 0.017 | 0.019 | 0.506 | 0.523 | 0.525 |
Table 2. Malignancy prediction metrics.
| Training | |||||
|---|---|---|---|---|---|
| Network | AUC | Accuracy | Sensitivity | Specificity | F1 |
| Mesh Only | 0.885 | 80.25 | 54.84 | 93.04 | 65.03 |
| Mesh+Encoder | 0.899 | 80.71 | 55.76 | 93.27 | 65.94 |
| Validation | |||||
| Network | AUC | Accuracy | Sensitivity | Specificity | F1 |
| Mesh Only | 0.881 | 80.37 | 53.06 | 92.11 | 61.90 |
| Mesh+Encoder | 0.808 | 75.46 | 42.86 | 89.47 | 51.22 |
| Testing LIDC-PM N=72 | |||||
| Network | AUC | Accuracy | Sensitivity | Specificity | F1 |
| Mesh Only | 0.790 | 70.83 | 56.10 | 90.32 | 68.66 |
| Mesh+Encoder | 0.813 | 79.17 | 70.73 | 90.32 | 79.45 |
| Testing LUNGx N=73 | |||||
| Network | AUC | Accuracy | Sensitivity | Specificity | F1 |
| Mesh Only | 0.733 | 68.49 | 80.56 | 56.76 | 71.60 |
| Mesh+Encoder | 0.743 | 65.75 | 86.11 | 45.95 | 71.26 |

Hey Wookjin, great read! I particularly enjoyed your in-depth discussion of nodule segmentation, since it was something I hadn’t really thought of before. Being a fellow blogger myself, I also really appreciate how organized and well-formatted everything was – it definitely made the content much more digestible overall. Keep up the awesome work!
LikeLike